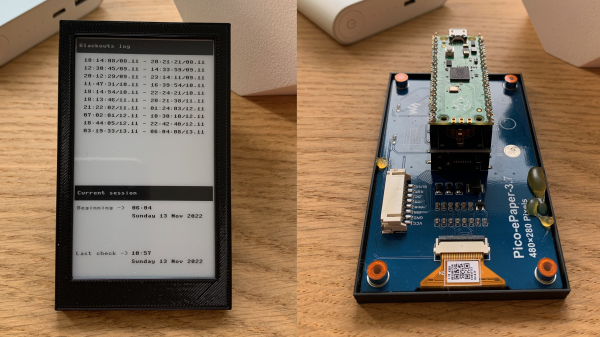
A two picture montage of the blackout logger, the left picture being the front e-ink display of the data logger in a black case and the second picture of the back of the data logger, with the raspberry pi pico show attached to an e-ink display, both sitting on a wooden table.

Blackout Logger Keeps Track Of Power Outages

[Dmytro Panin] lives in Kyiv, Ukraine where there have been rolling blackouts to stabilize the power grid. To help keep track of when the blackouts might happen, be they planned or emergency, and to get more information on how long the blackouts last, [Dmytro] has created a blackout logger.

The build consists of a Raspberry Pi Pico that connects to a DS3231 real time clock (RTC) with a Waveshare 3.7 inch eInk display which [Dmytro] puts into a custom 3D printed case. The RTC has it’s own small power supply, often times from a coin cell battery attached to the module, allowing it to keep time when the module and other devices attached to it are powered off.

The Raspberry Pi Pico is programmed to “poll” every 30 seconds, writing the current time to a file. Should the unit lose power, the last time, within a 30 second window, is available when power is restored and the unit wakes up again. Since the RTC has kept the current time, there is enough information to display the duration of the blackout. The eInk screen ensures that the information is readily available, even when there is no power.

War is not the only reason blackouts can occur and we’ve covered some issues with blackouts in Texas and California in the US.

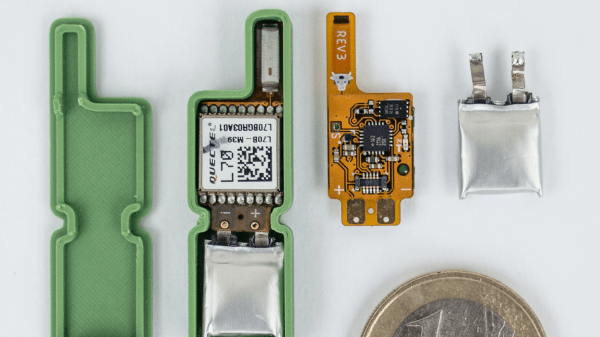
TickTag, a tiny GPS logger with 3d printed case, LiPo battery and a 1 Euro coin for size reference

Tiny GPS Logger For The Internet Of Animals

[Trichl] has created a tiny GPS logger, called ‘TickTag’, designed as an inexpensive location tracking option for animal studies. The low cost, tiny form factor, and large power density of the LiPo battery give it the ability to track large populations of small animals, including dogs and bats.

The TickTag is capable of getting 10,000 GPS fixes from its 30 mAh cell. Each unit is equipped with an L70B-M39 GPS module controlled by an Atmel ATtiny1626 microcontroller and sports a tiny AXE610124 10-pin connection header for programming and communication. GPS data is stored on a 128 kB EEPROM chip with each GPS location fix using 25 bits for latitude, 26 bits for longitude, and 29 bits for a timestamp. Add it all up and you get 10 bytes per GPS data point (25+26+29=80), giving the 10k GPS fix upper bound.

To record higher quality data and extend battery life, the TickTag can be programmed to record GPS location data using variable frequency intervals or when geofencing bounds have been crossed.

Continue reading “Tiny GPS Logger For The Internet Of Animals”

A Sleep Monitor For Minimum Outlay

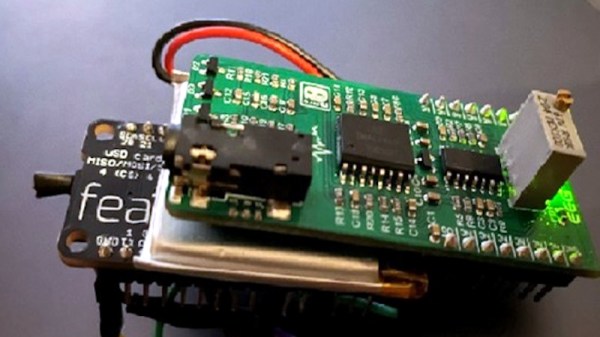
There are a variety of instruments used in sleep studies to measure bodily activity during sleep and consequent sleep quality. Many of them use techniques that perhaps aren’t so easy to replicate on the bench, but an EEG or electroencephalograph to measure brain waves can be achieved using a readily-available module. [Ben Jabituya] shows us a sleep monitor using one of these modules, an EGG Mikroe Click.

The brains of the operation is an Adafruit Adalogger Feather M0, which is hooked up to a headband containing the sensing electrodes. The write-up gives us a round-up of the available boards, which should be handy for any experimenters in this field. The firmware meanwhile was written using the Arduino IDE. It collects raw sampling data to an SD card, and one surprise comes in just how relatively small a space it requires to store a night’s results.

Finally, a Python script was used to process the data and turn it into a spectrogram to look at brain activity through the night. He envisages using the device for triggering lucid dreaming during REM sleep, but we can see it might be rather useful for sleep disorder sufferers, too. Take a look at it in the video below the break. Continue reading “A Sleep Monitor For Minimum Outlay”

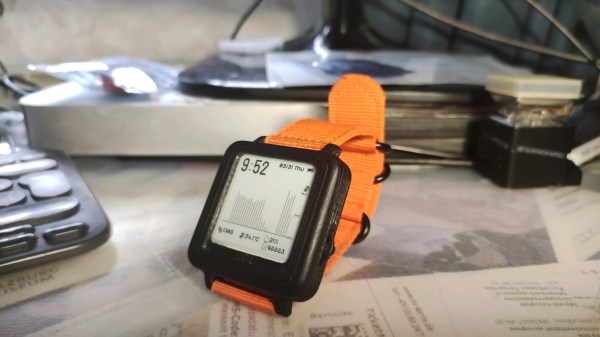
A Tshwatch on a table

TshWatch Helps You Learn More About Yourself

TshWatch is a project by [Ivan / @pikot] that he’s been working on for the past two years. [Ivan] explains that he aims to create a tool meant to help you understand your body’s state. Noticing when you’re stressed, when you haven’t moved for too long, when your body’s temperature is elevated compared to average values – and later, processing patterns in yourself that you might not be consciously aware of. These are far-reaching goals that commercial products only strive towards.

At a glance it might look like a fitness tracker-like watch, but it’s a sensor-packed logging and measurement wearable – with a beautiful E-Ink screen and a nice orange wristband, equipped with the specific features he needs, capturing the data he’d like to have captured and sending it to a server he owns, and teaching him a whole new world of hardware – the lessons that he shares with us. He takes us through the design process over these two years – now on the fifth revision, with first three revisions breadboarded, the fourth getting its own PCBs and E-Ink along with a, and the fifth now in the works, having received some CAD assistance for battery placement planning. At our request, he has shared some pictures of the recent PCBs, too!

Continue reading “TshWatch Helps You Learn More About Yourself”

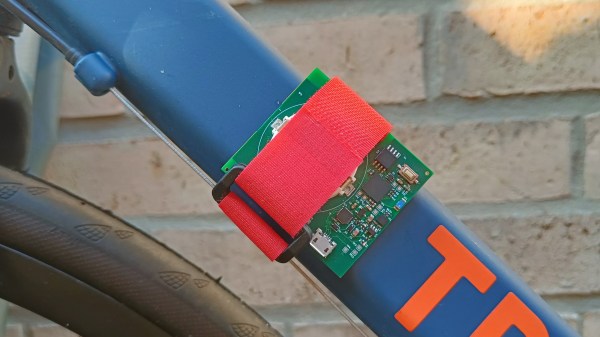
The Tracer board strapped to the frame of a bicycle with a red Velcro strap

Tracer, A Platform For All Things Movement Logging

[elektroThing] is building a lightweight, battery-powered board to track and measure movement of all kinds, called Tracer. Powered by an ESP32, it has a LSM6DSL 6DoF accelerometer & gyroscope sensor, and a VL53L0X Time-of-Flight sensor. A small Li-ion battery in a holder reportedly provides for 5 hours of streaming data over Bluetooth Low Energy (BLE) at 100 Hz. It’s essentially a wireless movement sensor platform to be paired with a more powerful computer for data logging and analysis. What’s such a platform good for?

They show it attached to a tennis racket, saying you could use the data to, for a start, count the strokes done in a given match. They’ve also strapped it to a bicycle’s crankshaft and used it as a cadence sensor – good for gauging your cycling efficiency! But of course, this can be used in more applications than sport. A device like this could be used for logging movement of any relatively nearby objects, be it your cat, an office chair, or a door someone might slam a bit too hard at times. Say, you wanted to develop a sleep tracker and were to collect some data for defining your algorithms and planning your hardware requirements – this would work wonders.

There’s already available example code for streaming data into the Phyphox data logging and graphing app, as well as schematics – hopefully, the full board files will be available soon. A worthy open-source opponent to commercial devices available for similar purposes, this platform is good news for any hacker that wants to do motion measurement projects without reinventing quite a few wheels at once. We are told this board might get to CrowdSupply soon, and we can’t wait! Platforms like these, if done well, can grow an offspring of new projects for us to have fun with, and our paid projects get all that much easier to work on.

We’ve shown projects with such sensors before – here’s one that helps your rifle aim by giving you data to debug your last-second rifle movements, and another that logs movement data from inside a football. There’s a million endpoints you could stream your data into, and we are told you could even use Google Sheets. Just a year ago, we held our Data Logging contest and the entries we received will surely point out quite a few under-explored areas in your daily life!

New Contest: Data Loggin’

What are we gonna’ do with all this data? Let’s make it something fun! That’s the point of the just-launched Data Loggin’ contest. Do something clever to automatically log a data set and display it in an interesting way. Three winners will each receive a $100 Tindie gift certificate for showing off an awesome project.

encoded by @Lagomorpho</a> in a knitted blanket.</p> " data-medium-file="https://hackaday.com/wp-content/uploads/2021/02/baby-sleep-patterns-knit-blanket.jpeg?w=400" data-large-file="https://hackaday.com/wp-content/uploads/2021/02/baby-sleep-patterns-knit-blanket.jpeg?w=625" tabindex="0" role="button" class="size-medium wp-image-464439" src="https://hackaday.com/wp-content/uploads/2021/02/baby-sleep-patterns-knit-blanket.jpeg?w=400" alt="" width="400" height="400" srcset="https://hackaday.com/wp-content/uploads/2021/02/baby-sleep-patterns-knit-blanket.jpeg 2680w, https://hackaday.com/wp-content/uploads/2021/02/baby-sleep-patterns-knit-blanket.jpeg?resize=250,250 250w, https://hackaday.com/wp-content/uploads/2021/02/baby-sleep-patterns-knit-blanket.jpeg?resize=400,400 400w, https://hackaday.com/wp-content/uploads/2021/02/baby-sleep-patterns-knit-blanket.jpeg?resize=625,625 625w, https://hackaday.com/wp-content/uploads/2021/02/baby-sleep-patterns-knit-blanket.jpeg?resize=1536,1536 1536w, https://hackaday.com/wp-content/uploads/2021/02/baby-sleep-patterns-knit-blanket.jpeg?resize=2048,2048 2048w" sizes="(max-width: 400px) 100vw, 400px" />
One year of baby sleep patterns encoded by @Lagomorpho in a knitted blanket.

Data logging is often an afterthought when working on a project, but the way you collect and store data can have a big effect on the end project. Just ask Tesla who are looking at a multi-thousand-dollar repair process for failing eMMC from too much logging. Oops. Should you log to an SD card? Internet? Stone tablets? (Yes please, we actually really want to see that for this contest.) Make sure to share those details so your project can be a template for others to learn from in the future.

Next, consider Schrodinger’s dataset: if the data is never used does it actually exist? Grab some attention with how you use this data. That automatic donut slicer you built can be used to slice up a tasty pie-chart of the minutes you spent on the elliptical this week. Your energy consumption can be plotted if you connect that OpenCV meter reader up to your favorite cloud service to visualize the data or a NodeRED dashboard if you’d rather keep things local. You could also make some of that data permanent, like this blanket that encoded baby’s sleep patterns in the colors.

You probably already have something harvesting data. Here’s the excuse you need to do something silly (or serious) with that data. Tells us about it by publishing a project page on Hackaday.io and don’t forget to use that “Submit Project To” menu to add it to the Data Loggin’ contest.

Underwater Logging For Science

Logging data with an Arduino is old-hat for most Hackaday readers. However, [Patricia Beddows] and [Edward Mallon] had some pretty daunting requirements. Their sensors were going underground and underwater as part of an effort to study conditions underwater and in caves. They needed to be accessible, yet rugged. They didn’t want to use batteries that would be difficult to take on airplanes, but also wanted more than a year of run time. You can buy all that, of course, if you are willing to pay the price.

Instead, they used off-the-shelf Arduino boards connected together inside PVC housings. Three alkaline AA batteries are compact and give them more than a year of run time. They wrote a journal paper to help other scientists use the same techniques for the Sensors journal published by the Multidisciplinary Digital Publishing Institute.

Continue reading “Underwater Logging For Science”