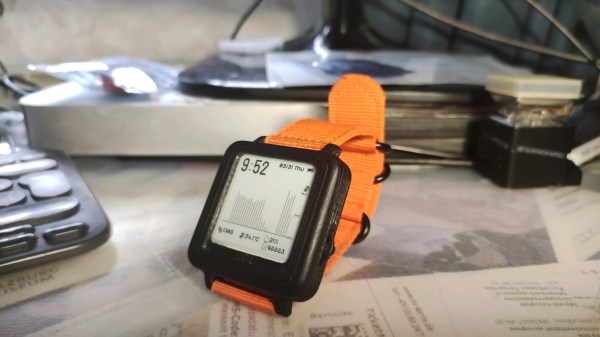
A Tshwatch on a table

TshWatch Helps You Learn More About Yourself

TshWatch is a project by [Ivan / @pikot] that he’s been working on for the past two years. [Ivan] explains that he aims to create a tool meant to help you understand your body’s state. Noticing when you’re stressed, when you haven’t moved for too long, when your body’s temperature is elevated compared to average values – and later, processing patterns in yourself that you might not be consciously aware of. These are far-reaching goals that commercial products only strive towards.

At a glance it might look like a fitness tracker-like watch, but it’s a sensor-packed logging and measurement wearable – with a beautiful E-Ink screen and a nice orange wristband, equipped with the specific features he needs, capturing the data he’d like to have captured and sending it to a server he owns, and teaching him a whole new world of hardware – the lessons that he shares with us. He takes us through the design process over these two years – now on the fifth revision, with first three revisions breadboarded, the fourth getting its own PCBs and E-Ink along with a, and the fifth now in the works, having received some CAD assistance for battery placement planning. At our request, he has shared some pictures of the recent PCBs, too!

Continue reading “TshWatch Helps You Learn More About Yourself”

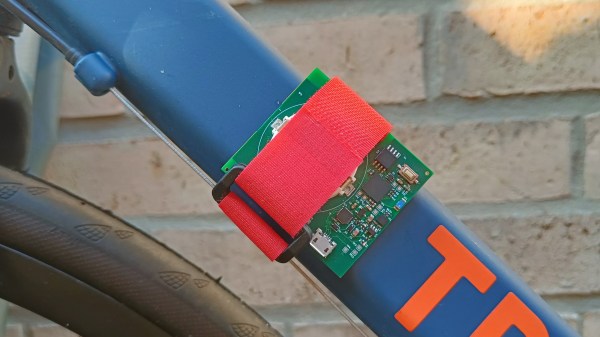
The Tracer board strapped to the frame of a bicycle with a red Velcro strap

Tracer, A Platform For All Things Movement Logging

[elektroThing] is building a lightweight, battery-powered board to track and measure movement of all kinds, called Tracer. Powered by an ESP32, it has a LSM6DSL 6DoF accelerometer & gyroscope sensor, and a VL53L0X Time-of-Flight sensor. A small Li-ion battery in a holder reportedly provides for 5 hours of streaming data over Bluetooth Low Energy (BLE) at 100 Hz. It’s essentially a wireless movement sensor platform to be paired with a more powerful computer for data logging and analysis. What’s such a platform good for?

They show it attached to a tennis racket, saying you could use the data to, for a start, count the strokes done in a given match. They’ve also strapped it to a bicycle’s crankshaft and used it as a cadence sensor – good for gauging your cycling efficiency! But of course, this can be used in more applications than sport. A device like this could be used for logging movement of any relatively nearby objects, be it your cat, an office chair, or a door someone might slam a bit too hard at times. Say, you wanted to develop a sleep tracker and were to collect some data for defining your algorithms and planning your hardware requirements – this would work wonders.

There’s already available example code for streaming data into the Phyphox data logging and graphing app, as well as schematics – hopefully, the full board files will be available soon. A worthy open-source opponent to commercial devices available for similar purposes, this platform is good news for any hacker that wants to do motion measurement projects without reinventing quite a few wheels at once. We are told this board might get to CrowdSupply soon, and we can’t wait! Platforms like these, if done well, can grow an offspring of new projects for us to have fun with, and our paid projects get all that much easier to work on.

We’ve shown projects with such sensors before – here’s one that helps your rifle aim by giving you data to debug your last-second rifle movements, and another that logs movement data from inside a football. There’s a million endpoints you could stream your data into, and we are told you could even use Google Sheets. Just a year ago, we held our Data Logging contest and the entries we received will surely point out quite a few under-explored areas in your daily life!

Winners Of Hackaday’s Data Loggin’ Contest: Bluetooth Gardening, Counting Cups, And Predicting Rainfall

The votes for Hackaday’s Data Loggin’ Contest have been received, saved to SD, pushed out to MQTT, and graphed. Now it’s time to announce the three projects that made the most sense out of life’s random data and earned themselves a $100 gift certificate for Tindie, the Internet’s foremost purveyor of fine hand-crafted artisanal electronics.

First up, and winner of the Data Wizard category, is this whole-garden soil moisture monitor by [Joseph Eoff]. You might not realize it from the picture at the top of the page, but lurking underneath the mulch of that lovely garden is more than 20 Bluetooth soil sensors arranged in a grid pattern. All of the data is sucked up by a series of solar powered ESP32 access points, and ultimately ends up on a Raspberry Pi by way of MQTT. Here, custom Python software generates a heatmap that indicates possible trouble spots in the garden. With its easy to understand visualization of what’s happening under the surface, this project perfectly captured the spirit of the category.

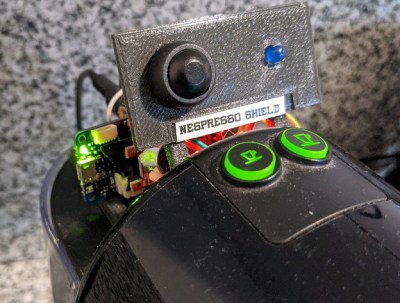
Next up is the Nespresso Shield from [Steadman]. This clever gadget literally listens for the telltale sounds of the eponymous coffee maker doing its business to not only estimate your daily consumption, but warn you when the machine is running low on water. The clever non-invasive method of pulling data from a household appliance made this a strong entry for the Creative Genius category.

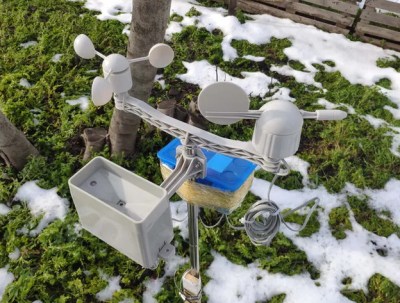
Last but certainly not least is this comprehensive IoT weather station that uses machine learning to predict rainfall. With crops and livestock at risk from sudden intense storms, [kutluhan_aktar] envisions this device as an early warning for farmers. The documentation on this project, from setting up the GPRS-enabled ESP8266 weather station to creating the web interface and importing all the data into TensorFlow, is absolutely phenomenal. This project serves as a invaluable framework for similar DIY weather detection and prediction systems, which made it the perfect choice for our World Changer category.

There may have only been three winners this time around, but the legendary skill and creativity of the Hackaday community was on full display for this contest. A browse through the rest of the submissions is highly recommended, and we’re sure the creators would love to hear your feedback and suggestions in the comments.

Continue reading “Winners Of Hackaday’s Data Loggin’ Contest: Bluetooth Gardening, Counting Cups, And Predicting Rainfall”

If You Can Measure It, You Must Display It

When can you be sure that you’re logging enough data? When you’re logging all of the data! Of course there are exceptions to the above tongue-in-cheek maxim, but it’s certainly a good start. Especially since data storage on, for instance, an SD card is so easy and cheap these days, there’s almost no reason to not record most every little bit of data that your project can produce. Even without an SD card, many microcontrollers have enough onboard flash, or heck even RAM, to handle whatever you throw at them. The trick, then, is to make sense out of that data, and for me at least, that often means drawing pretty pictures.

I was impressed this week by a simple but elegant stepper motor diagnosis tool hacked together by [Zapta]. Essentially, it’s a simple device: it’s a “Black Pill” dev board, two current sensors, an EEPROM for storing settings, and a touchscreen. Given that most of us with 3D printers rely on stepper motors to get the job done, it’s certainly interesting to do some diagnostics.

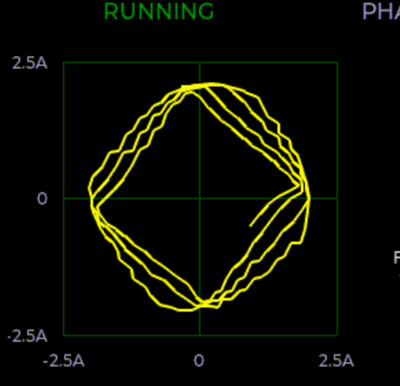
By logging voltage and current measurement on each phase of a stepper motor, you can learn a lot about what’s going on, at least if you can visualize all that data. And that’s where [Zapta]’s tool shines. It plots current vs motor speed to detect impedance problems. Tuning the current in the first place is a snap with Lissajous patterns, and it’ll track your extruder’s progress or look out for skipped steps for you across an entire print job. It does all this with many carefully targeted graphs.

I was talking to [Niklas Roy] about this, and he said “oh check out my hoverboard battery logger“. Here we go again! It sits inline with the battery and logs current and voltage, charging or discharging. Graphs let you visualize power usage over time, and a real-time-clock lets you sync it with video of using the hoverboard to help make even more sense of the data.

So what are you waiting for? Sensors are cheap, storage is cheap, and utilities to graph your data after the fact are plentiful. If you’re not logging all the relevant data, you’re missing out on some valuable insights. And if you are, we’d love to see your projects! (Hint, hint.)

New Contest: Data Loggin’

What are we gonna’ do with all this data? Let’s make it something fun! That’s the point of the just-launched Data Loggin’ contest. Do something clever to automatically log a data set and display it in an interesting way. Three winners will each receive a $100 Tindie gift certificate for showing off an awesome project.

encoded by @Lagomorpho</a> in a knitted blanket.</p> " data-medium-file="https://hackaday.com/wp-content/uploads/2021/02/baby-sleep-patterns-knit-blanket.jpeg?w=400" data-large-file="https://hackaday.com/wp-content/uploads/2021/02/baby-sleep-patterns-knit-blanket.jpeg?w=625" tabindex="0" role="button" class="size-medium wp-image-464439" src="https://hackaday.com/wp-content/uploads/2021/02/baby-sleep-patterns-knit-blanket.jpeg?w=400" alt="" width="400" height="400" srcset="https://hackaday.com/wp-content/uploads/2021/02/baby-sleep-patterns-knit-blanket.jpeg 2680w, https://hackaday.com/wp-content/uploads/2021/02/baby-sleep-patterns-knit-blanket.jpeg?resize=250,250 250w, https://hackaday.com/wp-content/uploads/2021/02/baby-sleep-patterns-knit-blanket.jpeg?resize=400,400 400w, https://hackaday.com/wp-content/uploads/2021/02/baby-sleep-patterns-knit-blanket.jpeg?resize=625,625 625w, https://hackaday.com/wp-content/uploads/2021/02/baby-sleep-patterns-knit-blanket.jpeg?resize=1536,1536 1536w, https://hackaday.com/wp-content/uploads/2021/02/baby-sleep-patterns-knit-blanket.jpeg?resize=2048,2048 2048w" sizes="(max-width: 400px) 100vw, 400px" />
One year of baby sleep patterns encoded by @Lagomorpho in a knitted blanket.

Data logging is often an afterthought when working on a project, but the way you collect and store data can have a big effect on the end project. Just ask Tesla who are looking at a multi-thousand-dollar repair process for failing eMMC from too much logging. Oops. Should you log to an SD card? Internet? Stone tablets? (Yes please, we actually really want to see that for this contest.) Make sure to share those details so your project can be a template for others to learn from in the future.

Next, consider Schrodinger’s dataset: if the data is never used does it actually exist? Grab some attention with how you use this data. That automatic donut slicer you built can be used to slice up a tasty pie-chart of the minutes you spent on the elliptical this week. Your energy consumption can be plotted if you connect that OpenCV meter reader up to your favorite cloud service to visualize the data or a NodeRED dashboard if you’d rather keep things local. You could also make some of that data permanent, like this blanket that encoded baby’s sleep patterns in the colors.

You probably already have something harvesting data. Here’s the excuse you need to do something silly (or serious) with that data. Tells us about it by publishing a project page on Hackaday.io and don’t forget to use that “Submit Project To” menu to add it to the Data Loggin’ contest.

Free Cloud Data Logging Courtesy Of Google

Pushing all of your data into “The Cloud” sounds great, until you remember that what you’re really talking about is somebody else’s computer. That means all your hard-crunched data could potentially become inaccessible should the company running the service go under or change the rules on you; a situation we’ve unfortunately already seen play out.

Which makes this project from [Zoltan Doczi] and [Róbert Szalóki] so appealing. Not only does it show how easy it can be to shuffle your data through the tubes and off to that big data center in the sky, but they send it to one of the few companies that seem incapable of losing market share: Google. But fear not, this isn’t some experimental sensor API that the Big G will decide it’s shutting down next Tuesday in favor of a nearly identical service with a different name. All your precious bits and bytes will be stored in one of Google’s flagship products: Sheets.

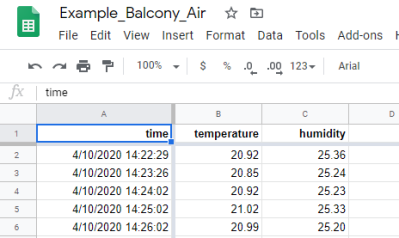
It turns out that Sheets has a “Deploy as Web App” function that will spit out a custom URL that clients can use to access the spreadsheet data. This project shows how that feature can be exploited with the help of a little Python code to push data directly into Google’s servers from the Raspberry Pi or other suitably diminutive computer.

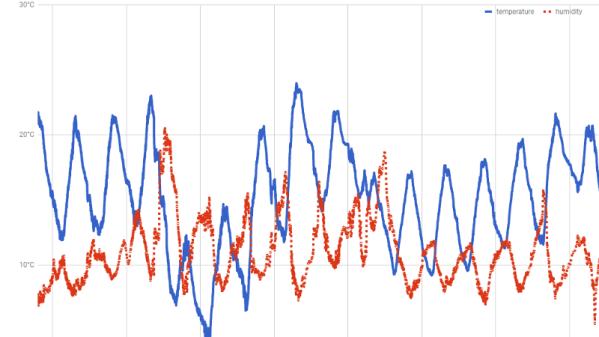
Here they’re using a temperature and humidity sensor, but the only limitation is your imagination. As an added bonus, the chart and graph functions in Sheets can be used to make high-quality visualizations of your recorded data at no extra charge.

You might be wondering what would happen if a bunch of hackers all over the world started pushing data into Sheets every few seconds. Honestly, we don’t know. The last time we showed how you could interact with one of their services in unexpected ways, Google announced they were retiring it on the very same day. It was probably just a coincidence, but to be on the safe side, we’d recommend keeping the update frequency fairly low.

Back in 2012, before the service was even known as Google Sheets, we covered how you could do something very similar by manually assembling HTTP packets containing your data. We’d say this validates the concept for long-term data storage, but clearly the methodology has changed considerably in the intervening years. Somebody else’s computer, indeed.

Rifle-Mounted Sensor Shows What Happens During Shot

People unfamiliar with shooting sports sometimes fail to realize the physicality of getting a bullet to go where you want it to. In the brief but finite amount of time that the bullet is accelerating down the barrel, the tiniest movement of the gun can produce enormous changes in its trajectory, and the farther away your target is, the bigger the potential error introduced by anticipating recoil or jerking the trigger.

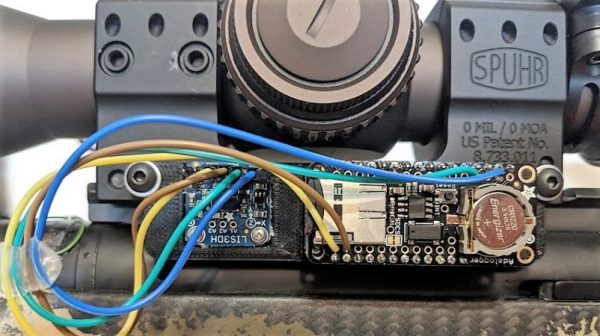
Like many problems this one is much easier to fix with what you can quantify, which is where this DIY rifle accelerometer can come in handy. There are commercial units designed to do the same thing that [Eric Higgins]’ device does but most are priced pretty dearly, so with 3-axis accelerometer boards going for $3, rolling his own was a good investment. Version 1, using an Arduino Uno and an accelerometer board for data capture with a Raspberry Pi for analysis, proved too unwieldy to be practical. The next version had a much-reduced footprint, with a Feather and the sensor mounted in a 3D-printed tray for mounting solidly on the rifle. The sensor captures data at about 140 Hz, which is enough to visualize any unintended movements imparted on the rifle while taking a shot. [Eric] was able to use the data to find at least one instance where he appeared to flinch.

We like real-world data logging applications like this, whether it’s grabbing ODB-II data from an autocross car or logging what happens to a football. We’ll be watching [Eric]’s planned improvements to this build, which should make it even more useful.